“The Periodic Table of Investment Returns depicts annual returns for 10 asset classes, ranked from best to worst performance for each calendar year.”https://www.callan.com/periodic-table/Click on: Download the PDF. I like this visual presentation of how asset categories fluctuate from yielding the highest returns one year to the lowest (or much lower) in subsequent years. The table…
Category: diversify
A visual representation of investment diversification
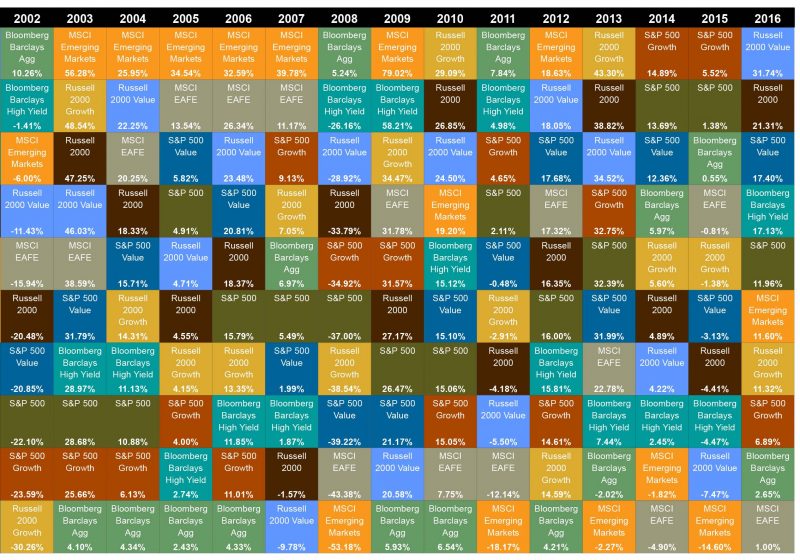
Check out the Squared Away blog for an effective visualization of investment diversification. I used the Callan Table in teaching diversification to my university students. It’s a great way to understand why no one can predict future investment returns. http://squaredawayblog.bc.edu/squared-away/the-picture-of-investment-diversity/ Source: Financial Planning for Women